

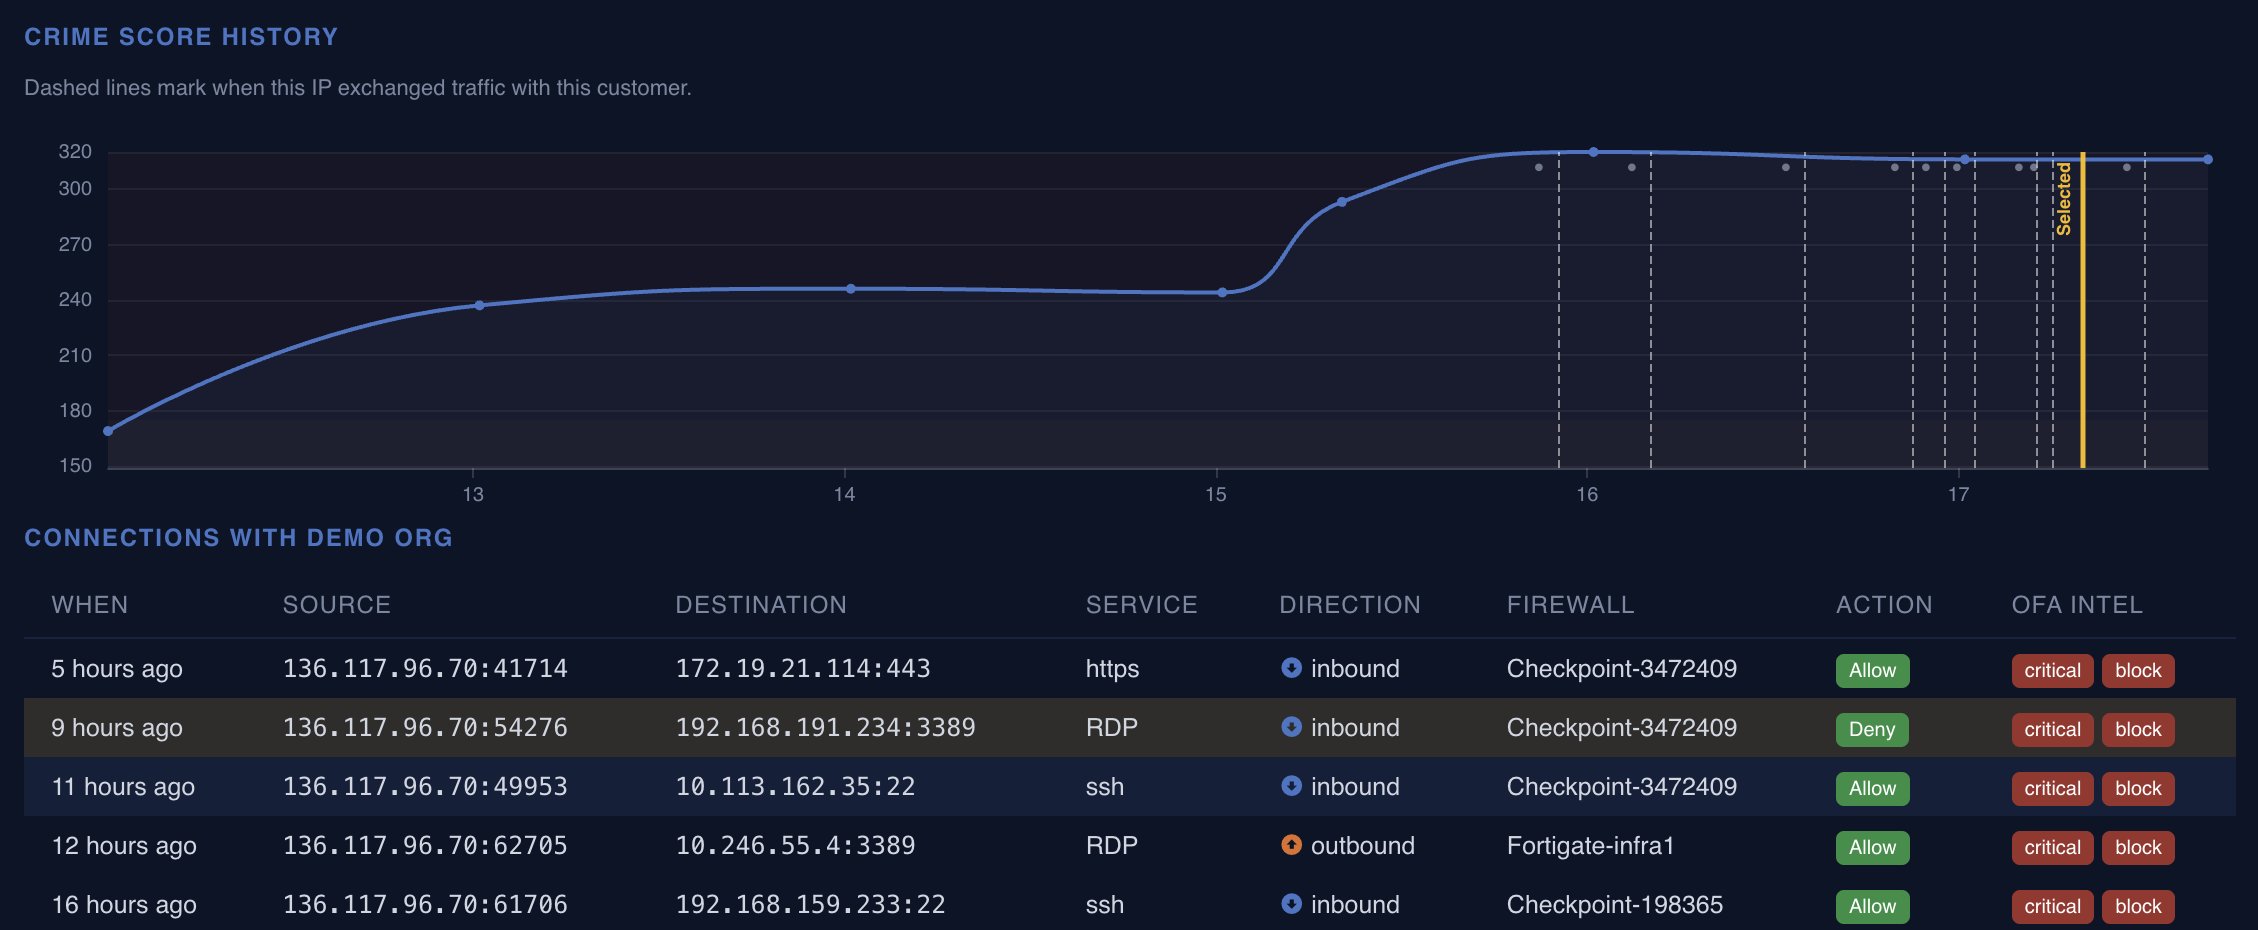
The score didn’t stop the traffic
The score rises in two phases: a steady climb through day 13 and 14, a plateau, then a sharper rise around day 15 into day 16 where it settles near its ceiling. What the dashed lines show is that this IP kept connecting to Demo Org’s infrastructure throughout that entire period, including after the score had already reached Critical territory. A rising score describes accumulating evidence against a source. It doesn’t, on its own, stop a firewall rule that was never configured to check it.What the connections actually were
The table lists five sessions from the hours before this snapshot: an inbound HTTPS connection through Checkpoint-3472409, an inbound RDP attempt through the same device, an inbound SSH connection, an outbound RDP session through Fortigate-infra1, and an inbound SSH connection through Checkpoint-198365. Every row carries the same OFA Intel tags — critical and block — regardless of outcome. Of the five, four were Allowed and one, the RDP attempt, was Denyed.Why RDP and SSH specifically
Both protocols are remote management access, not general application traffic. It’s the kind of service a Critical-scored source targets when the goal is direct control over a host rather than data collection. Four allowed sessions across HTTPS, RDP, and SSH, from a source already carrying a plateaued Critical score, is the flow-level version of what the aggregate charts elsewhere in this report describe in percentages: scored, corroborated activity that reached the destination anyway.Proof of Value engagements surface this same connection-level detail for indicators already active against a client’s own infrastructure. Start a Proof of Value.