

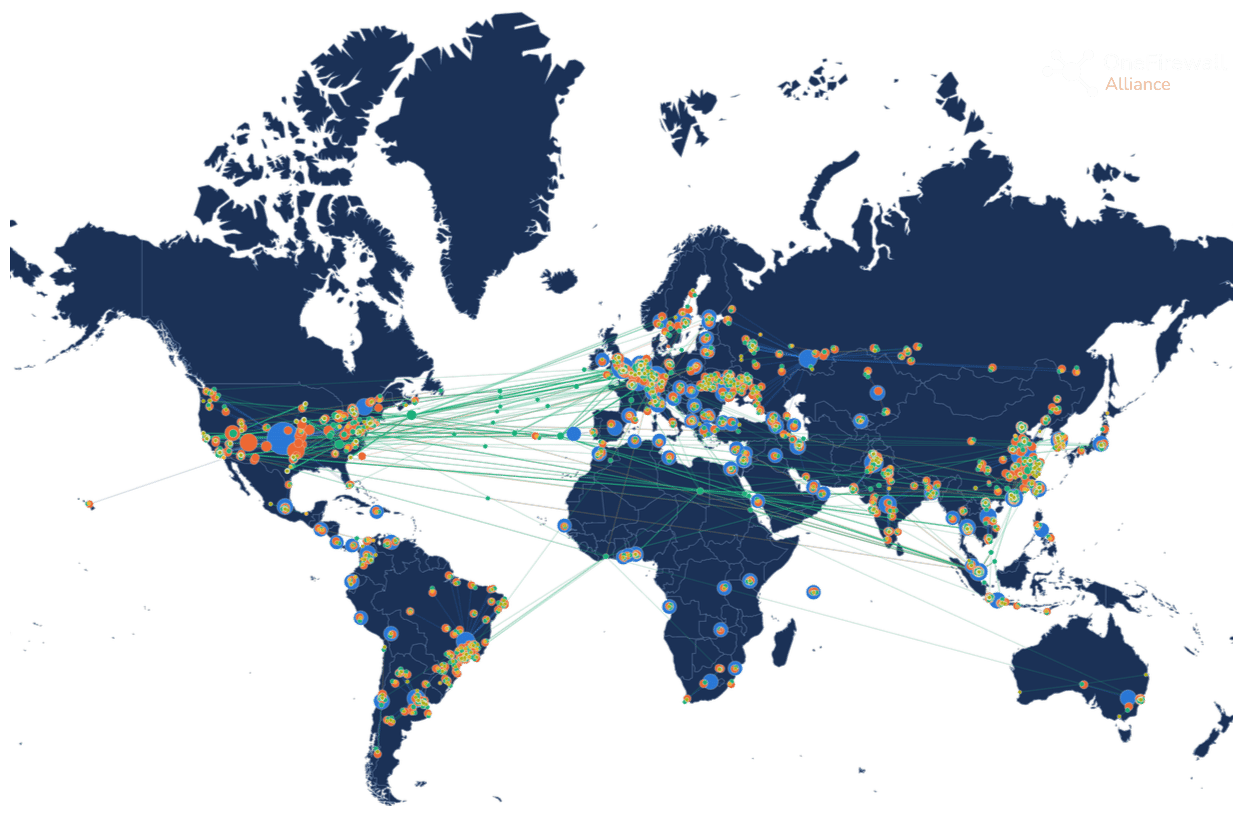
Why correlation is the relevant unit, not the dot
A single organization only observes the traffic that reaches its own edge. If an IP scans a SaaS platform in Frankfurt on Monday and hits a logistics company in São Paulo on Wednesday, neither organization has enough information on its own to know it’s the same source. Each event is logged and closed independently. Cross-member correlation changes what’s visible. When two members log traffic from the same address within a correlated window, OneFirewall links the two observations and adjusts the confidence assigned to that indicator. This is the Cross-Member Temporal Correlation factor in the Crime Score model: it’s a direct input into how a score is calculated, not a separate visualization layered on top.Reading the density
The concentration of dots over North America, Western Europe, and parts of Asia reflects where the Alliance currently has the most members and sensors reporting, not where all attack traffic originates. Coverage is a function of participation. A sparse region on the map is a gap in the dataset, not a low-risk area. Additional members reporting from that region shorten the interval between an indicator being observed and being enforced elsewhere.Operational effect
For a single firewall relying only on its own logs, an indicator has to be observed locally before it can be acted on. With cross-member correlation, the same indicator can already carry a Crime Score derived from sightings at other members before it reaches a given perimeter.Proof of Value engagements run this same correlation against a client’s own edge traffic. Start a Proof of Value.