

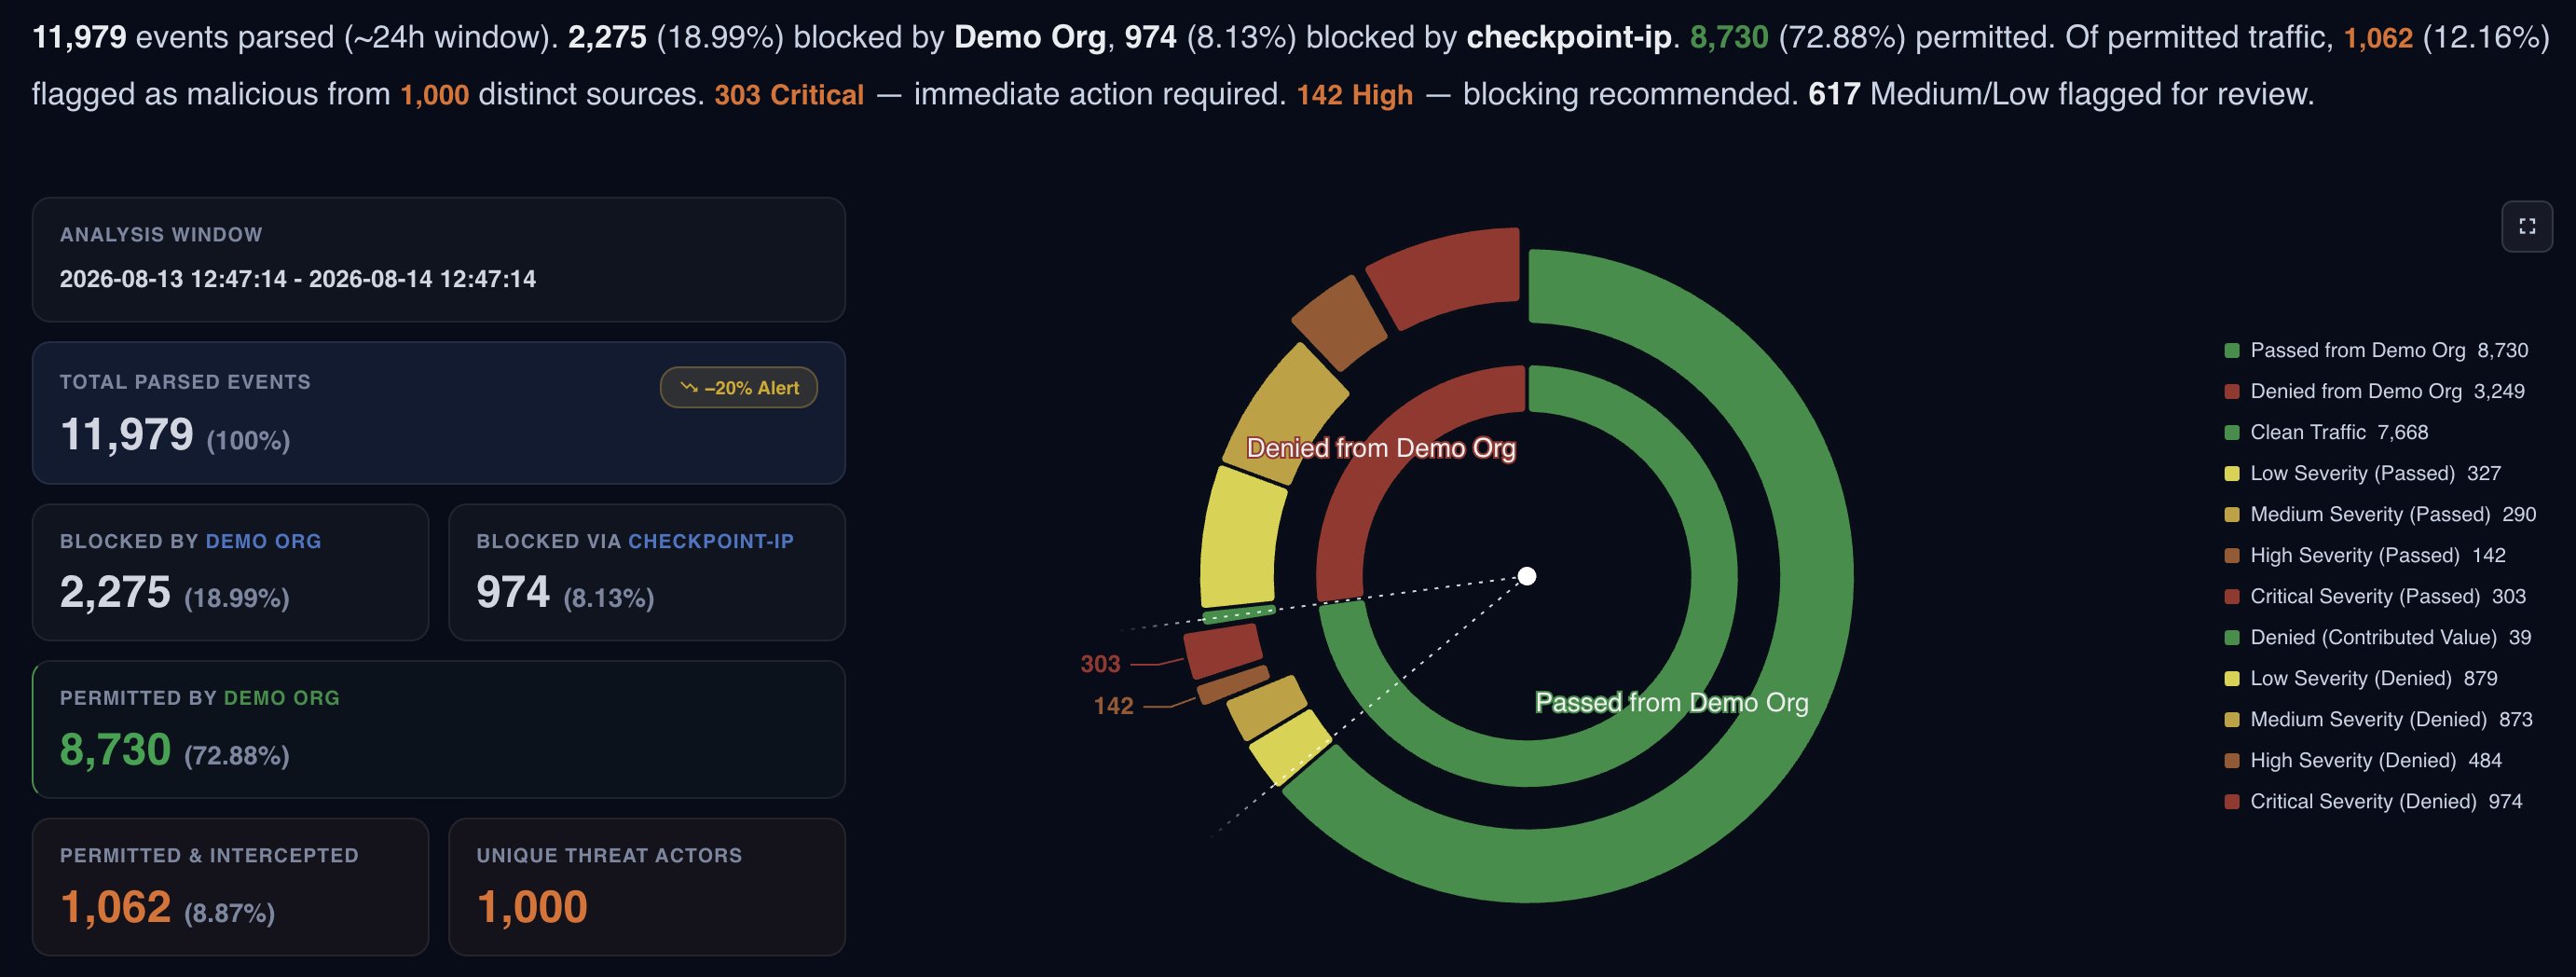
Event breakdown
11,979 events were parsed. 2,275 (18.99%) were already blocked by the client’s own firewall, and 974 (8.13%) more were blocked by an existing checkpoint-ip integration. The remaining 8,730 (72.88%) were permitted. Of that permitted traffic, 1,062 (12.16%) was flagged as malicious, from 1,000 distinct sources, a near one-to-one ratio between flagged events and unique attackers, consistent with broad opportunistic scanning rather than a single persistent actor. Of the flagged events, 303 were Critical (immediate action), 142 High (blocking recommended), and 617 Medium or Low (routed for review).Trend indicator
The dashboard also shows a -20% change on total parsed events versus the prior comparison window. A drop of that size can reflect a legitimate change in traffic patterns, or an attacker shifting to a different vector after being blocked elsewhere. A continuous monitoring window surfaces that kind of shift; a report generated on a monthly cycle would not.What the window represents
This output corresponds to the standard Proof of Value process: a VM deployed against real edge traffic, logging continuously, matched against the Alliance’s threat intelligence, producing a volume breakdown, a split between traffic already blocked and traffic that wasn’t, and a severity-ranked list of what remains.Proof of Value engagements produce this same report against a client’s own traffic. Start a Proof of Value.