📊 Dedicated Monitoring Page
We’ve introduced a brand new page in the OneFirewall platform designed to showcase the value of deployed Agents. This dashboard highlights how each agent is performing in terms of detecting and blocking malicious actors in real time.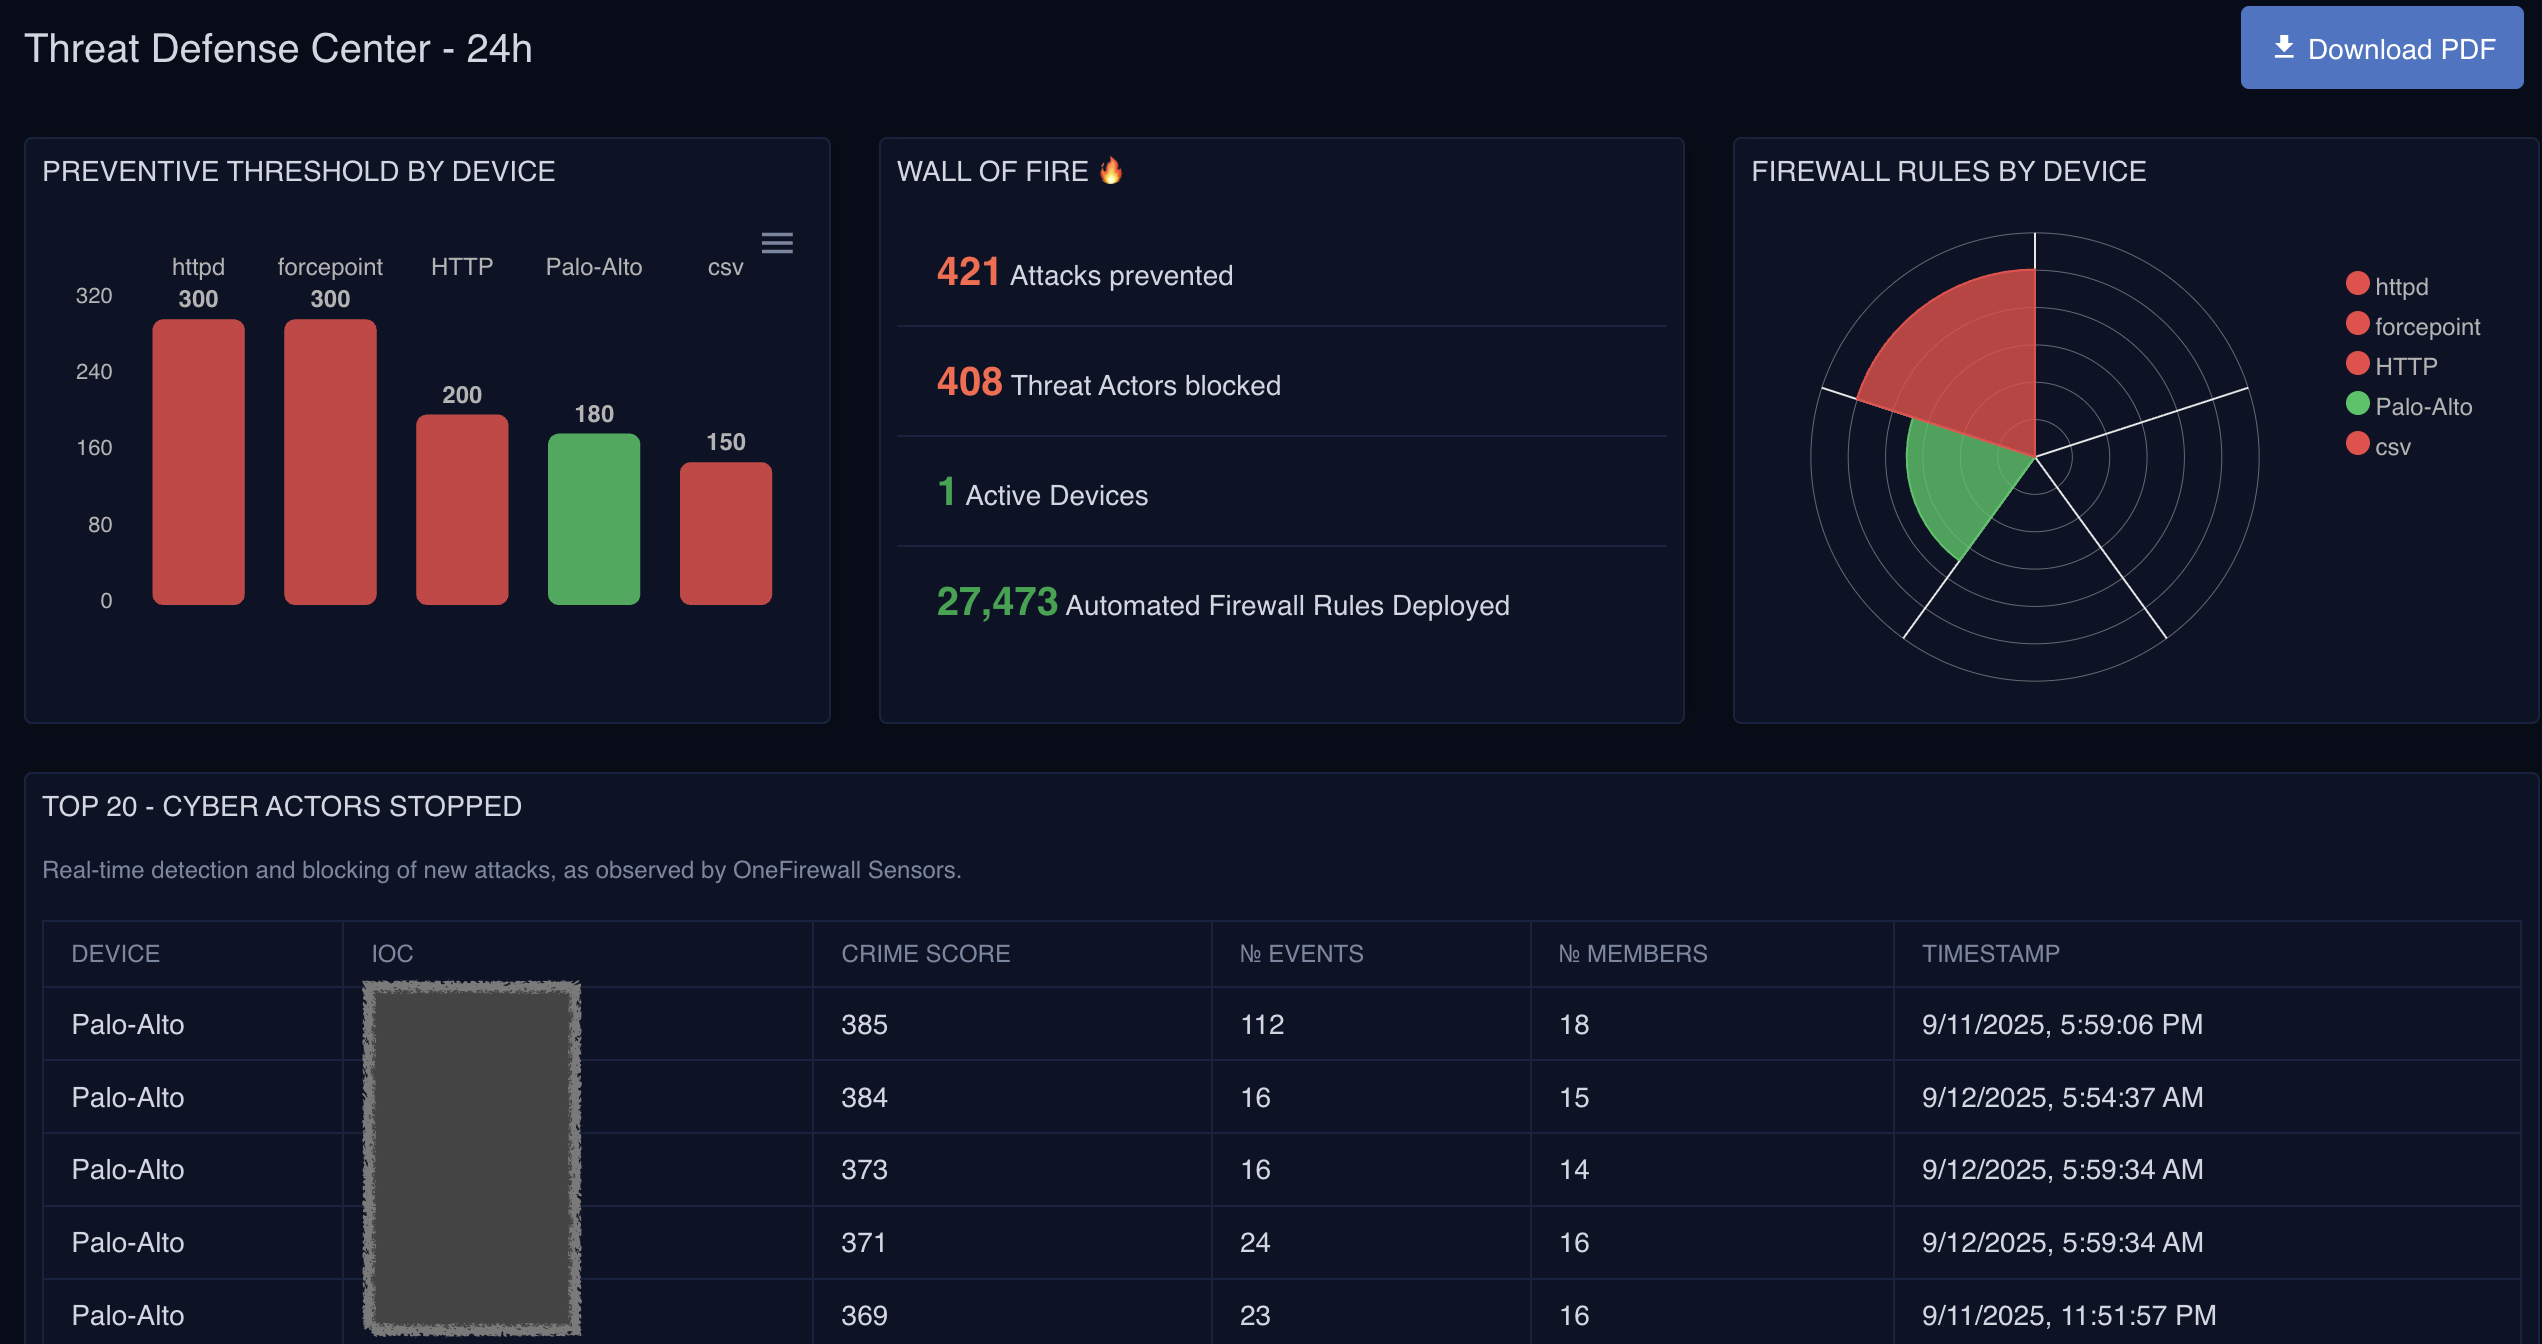
✨ New Features
-
Agent Overview Charts
- Polar area visualization of each agent’s blacklist size, making it easy to compare protection coverage across environments.
- Bar chart showing per-agent scores, dynamically color-coded by data freshness (🟢 updated in the last 24h, 🔴 stale).
-
Blocked Rules Time-Series
- Events are now aggregated into 10-minute buckets, letting you see the volume of attacks blocked over time.
- Fully interactive zoom: drill down to short time windows or zoom out for long-term attack patterns.
- Empty periods are represented with 0-count buckets, providing clear visibility into both active and quiet periods.
-
Enhanced Tooltips
- Rich detail on hover, including IP, score, number of events, members affected, and blacklist size, so analysts get immediate context without switching views.
🧩 Backend & Infrastructure Improvements
- Optimized MongoDB and Elasticsearch queries to only fetch relevant data (e.g., last 24h), ensuring fast page loads.
- Implemented pre-bucketing and debouncing in time-series rendering, preventing browser crashes even with large datasets.
- Unified query logic across MongoDB + Elasticsearch for simplified backend operations.
🌐 Why It Matters
This release provides security teams with a dedicated visualization page that proves the real-world value of OneFirewall Agents:- Clear evidence of malicious actors being blocked.
- Transparency into how each deployed agent is performing.
- Actionable insights into attack trends and coverage.