
The first split: enforcement decision
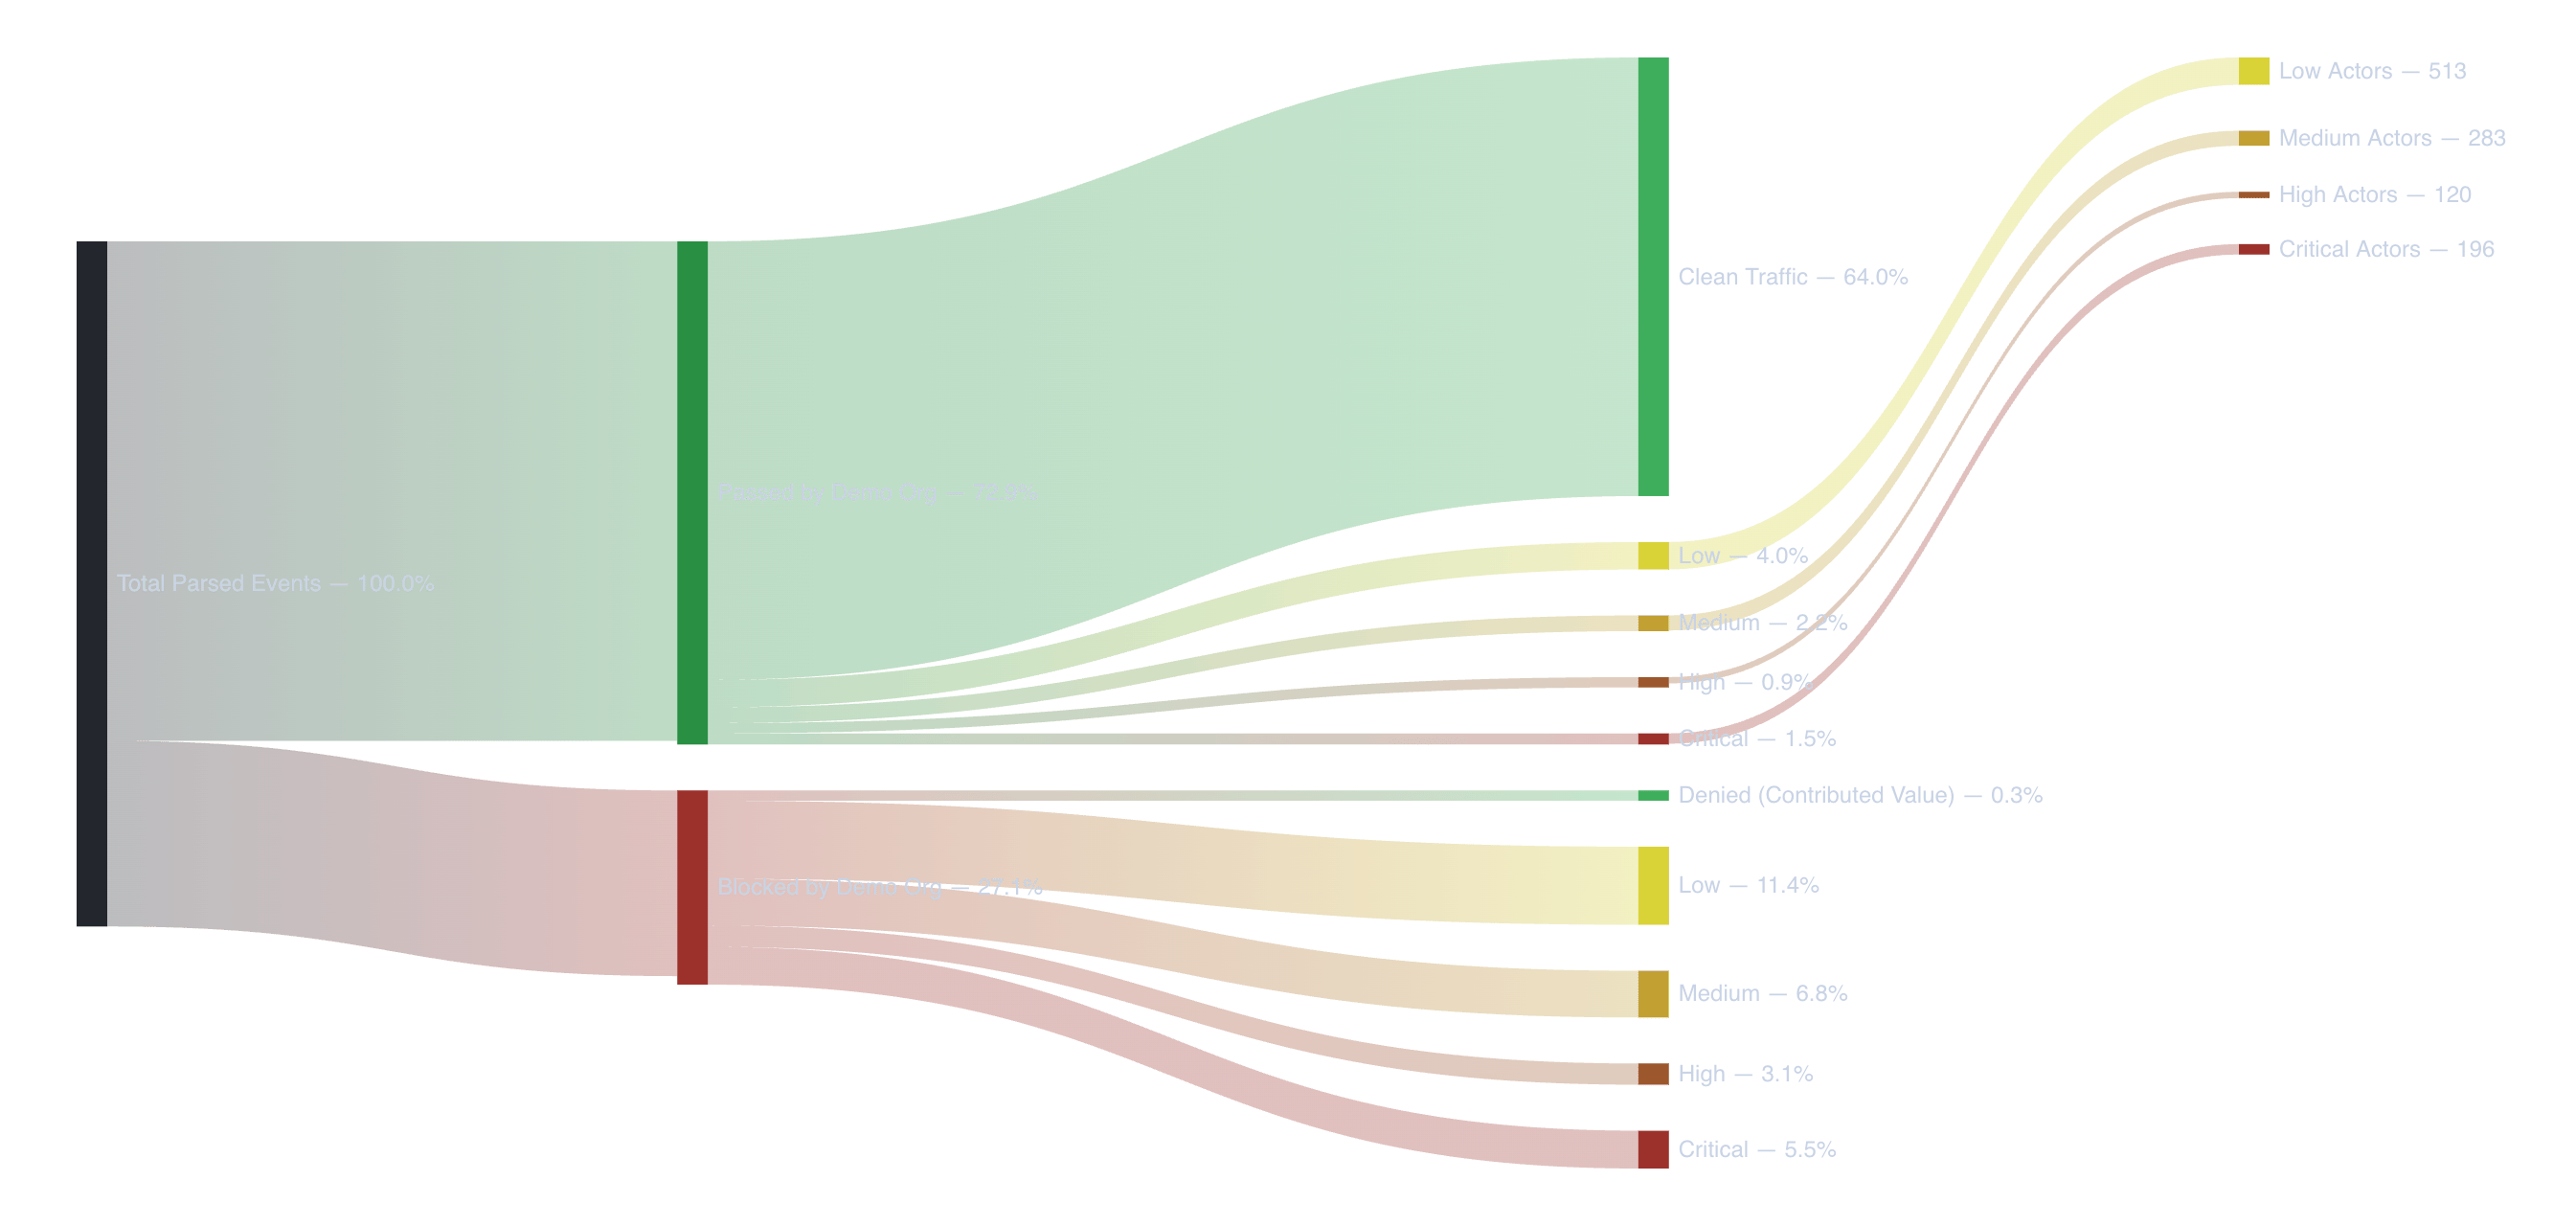
Of total parsed events, 72.9% were passed by Demo Org’s firewall and 27.1% were blocked. This is the enforcement outcome on its own, before severity is factored in.Severity within each branch
Both branches are then broken down by the same four severity bands, independent of the enforcement action already taken. Within the passed branch: 64.0% of total events were Clean Traffic, with 4.0% Low, 2.2% Medium, 0.9% High, and 1.5% Critical severity slipping through despite being permitted. Within the blocked branch: 11.4% Low, 6.8% Medium, 3.1% High, and 5.5% Critical. Most of what Demo Org’s firewall blocked was, independently, also scored as malicious by OneFirewall. A small slice, 0.3%, is labeled Denied (Contributed Value): traffic the firewall blocked that OneFirewall’s scoring assessed as clean, cross-validating that portion of the existing rule set rather than flagging it as a gap.Convergence into actor counts
On the right, the four severity bands from both branches converge into unique threat actor totals, deduplicated across whatever enforcement decision already applied to their traffic: 513 Low Actors, 283 Medium Actors, 120 High Actors, and 196 Critical Actors. This is a count of distinct sources at each severity level, not event volume. A single actor can appear in both the passed and blocked branches across different events and still counts once here.Proof of Value engagements produce this same flow breakdown against a client’s own traffic. Start a Proof of Value.