

Reading the columns
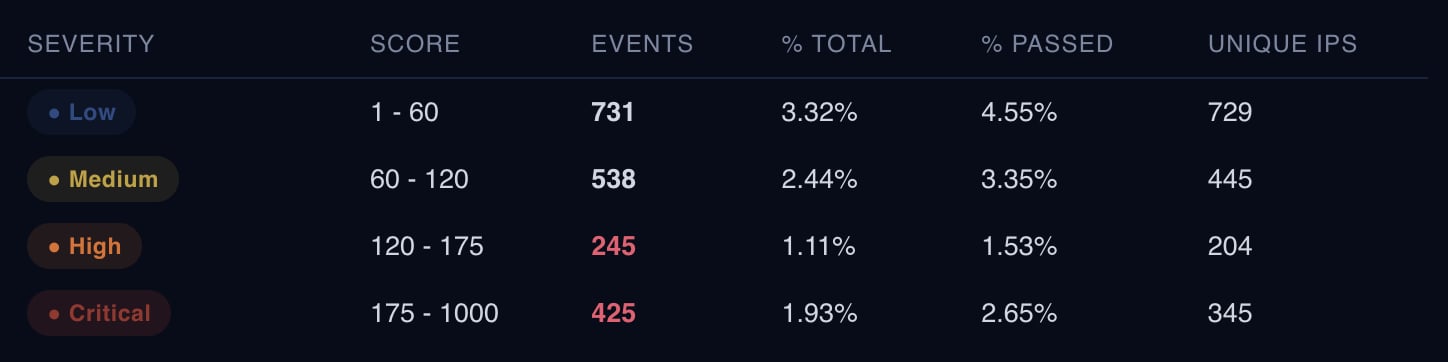
Low (score 1–60) accounts for 731 events, 3.32% of total traffic, 4.55% of permitted traffic, and 729 unique IPs. Medium (60–120) accounts for 538 events, 2.44% total, 3.35% permitted, 445 unique IPs. High (120–175) accounts for 245 events, 1.11% total, 1.53% permitted, 204 unique IPs. Critical (175–1000) accounts for 425 events, 1.93% total, 2.65% permitted, 345 unique IPs.Why unique IPs matter alongside event counts
Low severity has the highest event count but also the highest ratio of unique IPs to events — 729 IPs behind 731 events, close to one-to-one, consistent with broad, low-intensity scanning from many distinct sources. Critical severity shows more repetition per source (345 IPs behind 425 events), which is more consistent with a smaller set of actors making repeated attempts. The same event count can describe very different attacker behavior depending on how concentrated it is.Score ranges tie back to the same model
These bands use the same 0–1000 Crime Score scale applied everywhere else in the platform. The thresholds separating Low from Medium from High from Critical aren’t specific to this report — they’re the same scoring boundaries used for enforcement decisions elsewhere in the deployment.Proof of Value engagements generate this table against a client’s own traffic. Start a Proof of Value.