

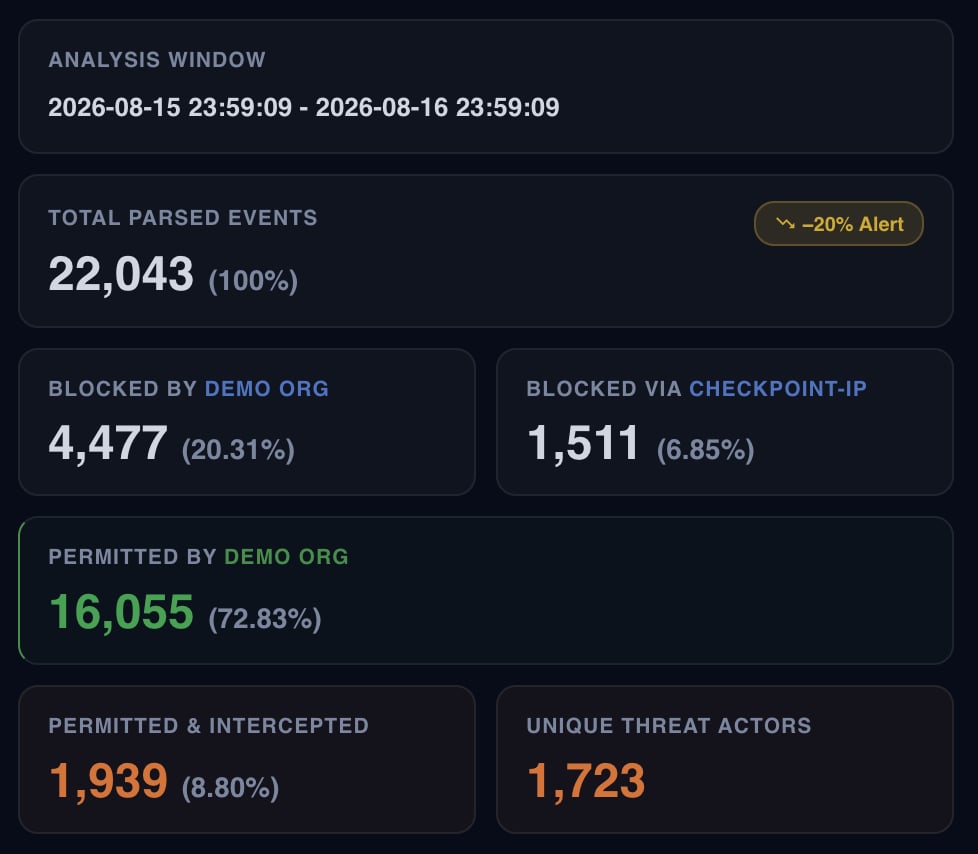
The full chain in one place
Of 22,043 total events, 4,477 (20.31%) were blocked by Demo Org’s own firewall and 1,511 (6.85%) more were blocked through the checkpoint-ip integration. 16,055 (72.83%) were permitted. Of that permitted traffic, 1,939 (8.80%) was flagged and intercepted as malicious after the fact. Across the entire window, 1,723 unique threat actors were identified.Why 1,723 doesn’t equal the sum of the other actor counts
The severity table elsewhere in this report lists unique IP counts per band that don’t add up to 1,723 when summed directly, because a single actor can generate events across more than one severity band or appear in both the blocked and permitted branches during the same window. 1,723 is the deduplicated total across the entire dataset, not a sum of the per-band figures.What a -20% change means here
The prior-period comparison is carried at the top level of this summary, not buried in a footnote. A 20% drop in total parsed events changes the denominator every other percentage in this report is measured against, which is why it’s surfaced before any of the breakdown figures.Proof of Value engagements produce this exact daily summary against a client’s own edge traffic. Start a Proof of Value.