
Same indicator, independent sightings
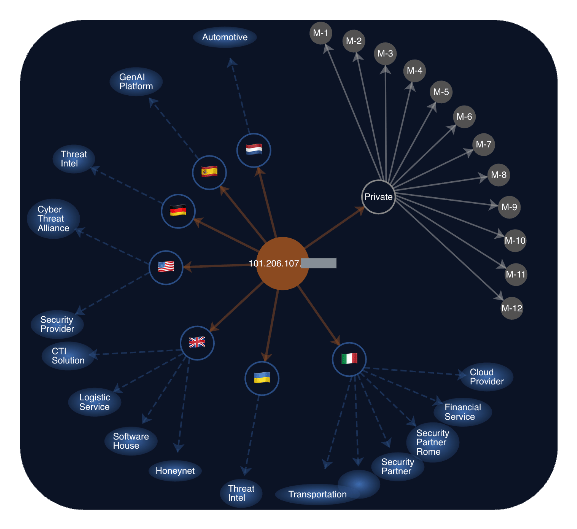
Every line on this graph is a separate organization that logged traffic from this address on its own edge, with no visibility into who else was seeing the same thing. None of these 19 members coordinated with each other before the correlation happened — OneFirewall links the sightings after the fact, based on the shared indicator and a correlated time window. That’s what turns 19 isolated log entries into one graph.Anonymized members still contribute
Twelve of the nineteen nodes carry no country flag or organization name — just a private label (M-1 through M-12). Contributing an observation to the Alliance doesn’t require disclosing who you are. A member can report an indicator, have it factored into the Crime Score, and stay off any public-facing map. This matters for organizations that don’t want their own exposure visible to competitors or to the attacker.The same address, unrelated sectors
The public nodes on this graph aren’t clustered in one industry. The tags attached to them include a GenAI platform, an automotive company, a logistics provider, a software house, a financial services firm, a cloud provider, and a honeynet — alongside dedicated threat intel and CTI organizations. A single sector’s isolated monitoring would have caught one hit each. Correlating across all of them is what surfaces the same address as a repeat offender rather than seven unrelated one-off events.Proof of Value engagements run this same cross-member correlation against a client’s own edge traffic. Start a Proof of Value.