

Two branches, same severity scale
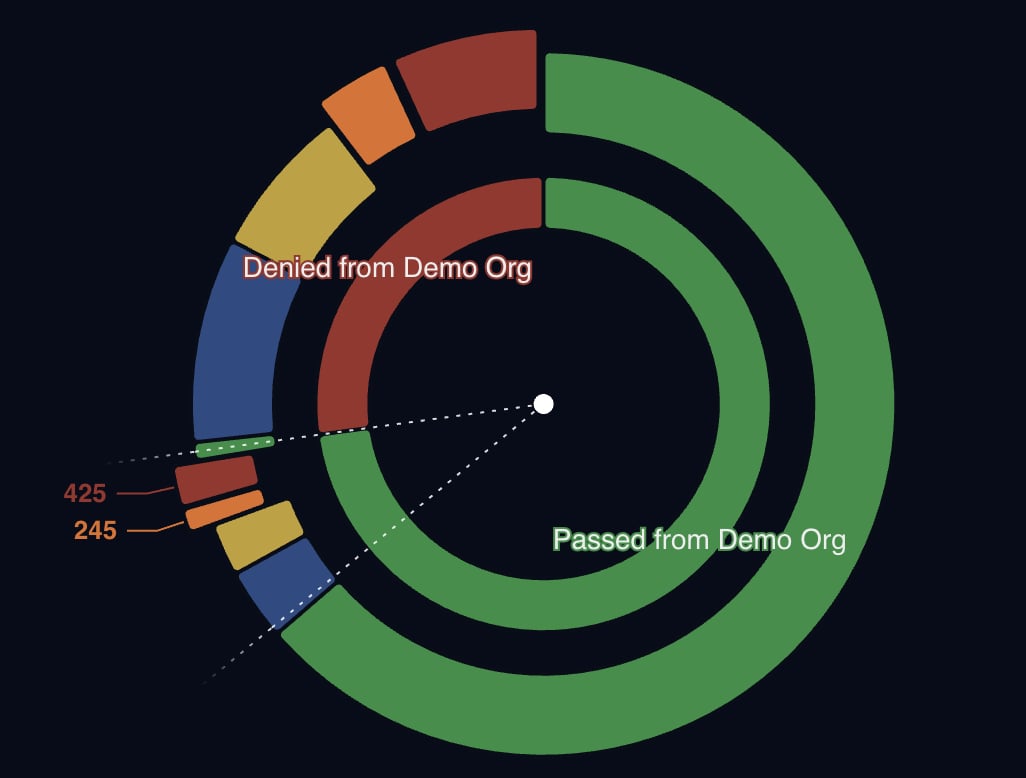
The outer green band on the right is traffic passed by Demo Org’s firewall. The segmented band on the left is traffic denied by Demo Org, broken into the same Low, Medium, High, and Critical bands used throughout this analysis, with 425 Critical and 245 High events called out specifically. Both branches are scored using the same Crime Score thresholds, which is what makes it possible to compare severity across an enforcement boundary instead of only within one side of it.The thin green segment
A narrow green slice sits at the boundary between the two branches — a small amount of already-denied traffic that OneFirewall’s scoring also assessed as clean. It’s a minor share of the total, and it functions as a cross-check on the existing rule set rather than a finding that needs action: traffic the firewall blocked and OneFirewall independently agrees was not malicious.Why the same data appears twice in this report
This chart and the enforcement-split donut cover the same underlying numbers from different angles. The donut answers “how much was passed versus denied.” This one answers “how severe was the traffic on each side of that decision,” which is the detail a flat pass/deny ratio doesn’t carry on its own.Proof of Value engagements produce this same breakdown against a client’s own firewall decisions. Start a Proof of Value.