

Severity bands
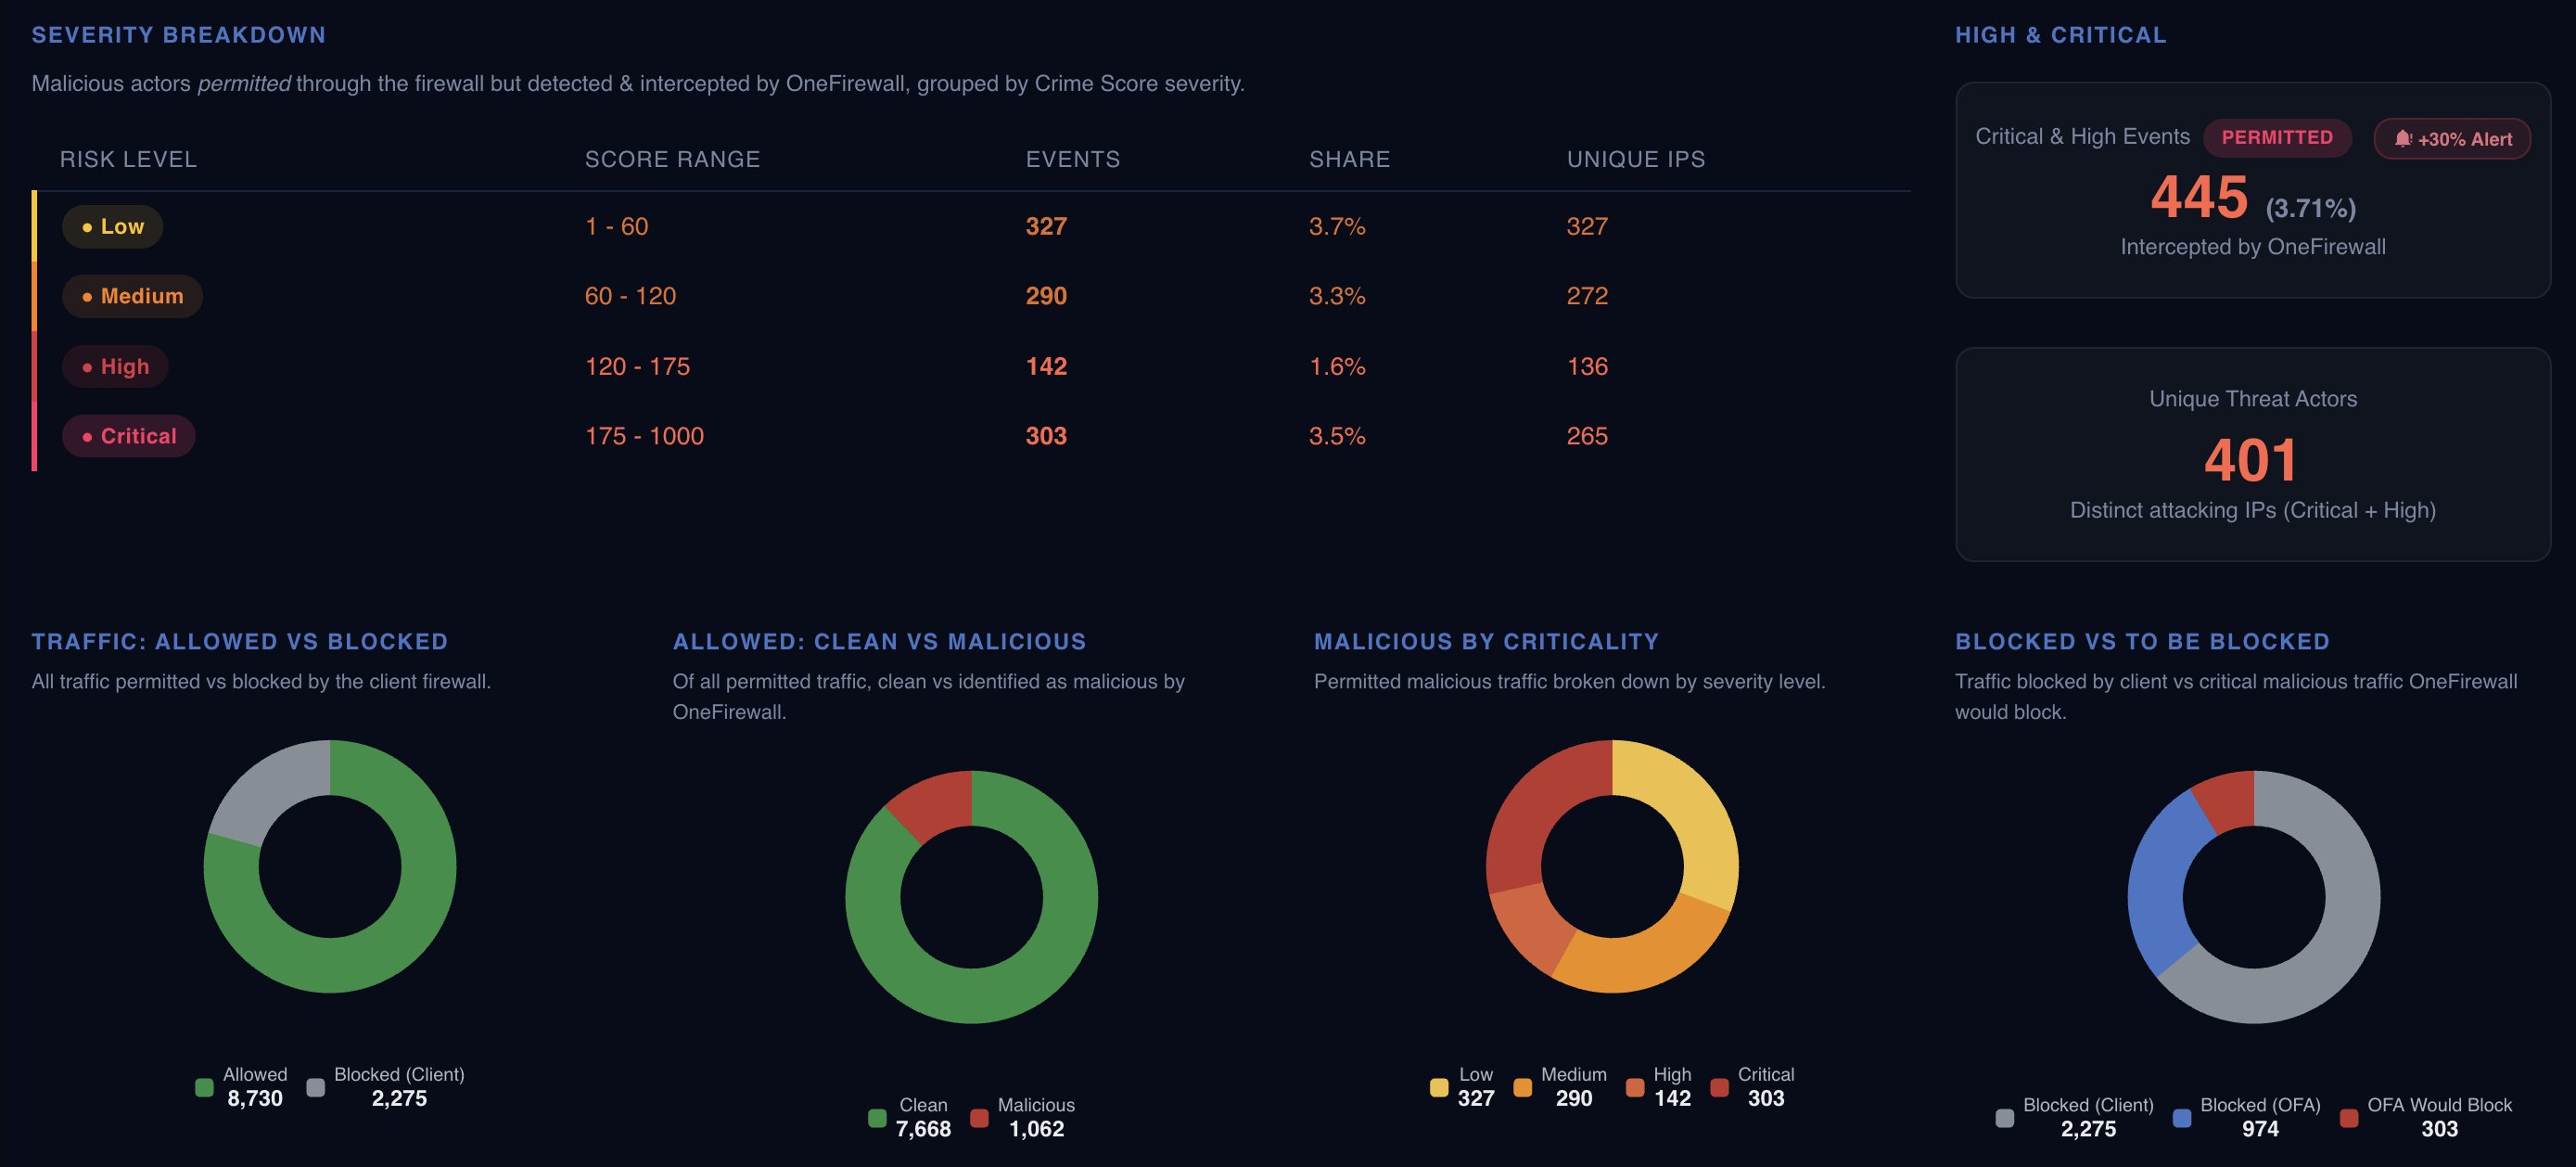
Permitted-but-malicious traffic splits into four bands: Low (score 1–60, 327 events), Medium (60–120, 290 events), High (120–175, 142 events), and Critical (175–1000, 303 events). Each band tracks unique IPs as well as event counts. 303 critical events from 265 distinct sources is a different scenario than 303 events from a small number of IPs repeatedly hitting the same endpoint.Delta over baseline
The panel on the right combines High and Critical: 445 events, 3.71% of permitted traffic, flagged with a +30% change against the prior baseline, from 401 unique threat actors. The alert is a delta, not a static count. A 30% increase in high-severity permitted traffic indicates a change in exposure that a snapshot report would not capture on its own.Resulting priority order
The four donuts below break the totals down further: of the traffic evaluated, 8,730 events were allowed and 2,275 were blocked by the client’s own firewall; of what was allowed, 7,668 were clean and 1,062 were malicious; and across the full blocking picture, the client’s firewall accounted for 2,275, OneFirewall’s checkpoint-ip enforcement accounted for another 974, and 303 critical-severity events remained unblocked at the time of this snapshot.Proof of Value engagements produce this severity-ranked breakdown against a client’s own traffic. Start a Proof of Value.